Pandas and XlsxWriter
The following is a simple example of creating a
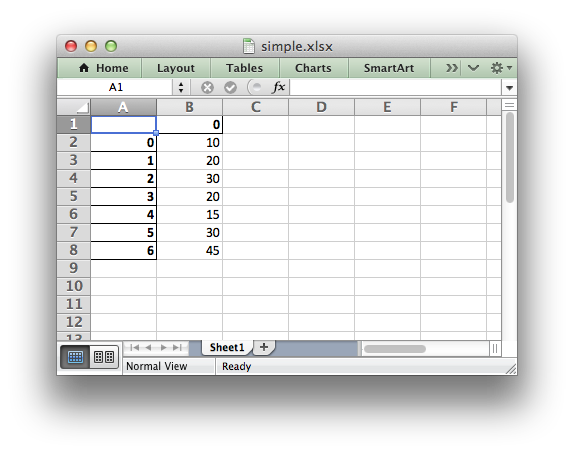
Pandas dataframe and using the to_excel()
method to write that data out to an Excel file:
import pandas as pd


# Create a Pandas dataframe from the data.
df = pd.DataFrame([10, 20, 30, 20, 15, 30, 45])

# Create a Pandas Excel writer using XlsxWriter as the engine.
writer = pd.ExcelWriter('simple.xlsx', engine='xlsxwriter')
df.to_excel(writer, sheet_name='Sheet1')

# Close the Pandas Excel writer and output the Excel file.
writer.save()
The output from this would look like the following:
The option of adding an alternative writer engine is only available in
Pandas version 0.13 and later.
In order to add a chart to the worksheet we first need to get access to the underlying XlsxWriter Workbook and Worksheet objects.
Continuing on from the above example we do that as follows:
# Same as above.
writer = pd.ExcelWriter('simple.xlsx', engine='xlsxwriter')
df.to_excel(writer, sheet_name='Sheet1')

# Get the xlsxwriter objects from the dataframe writer object.
workbook  = writer.book
worksheet = writer.sheets['Sheet1']
This is equivalent to the following code when using XlsxWriter on its own:
workbook  = xlsxwriter.Workbook('simple.xlsx')
worksheet = workbook.add_worksheet()
Once we have a Workbook and Worksheet object we can use them to add a chart:
# Create a chart object.
chart = workbook.add_chart({'type': 'column'})

# Configure the series of the chart from the dataframe data.
chart.add_series({'values': '=Sheet1!$B$2:$B$8'})

# Insert the chart into the worksheet.
worksheet.insert_chart('D2', chart)
The Chart API is explained in the Chart Class and the Working with Charts sections of XlsxWriter documentation.