Using Pandas and XlsxWriter to create Excel charts
An introduction to the creation of Excel files with charts using Pandas and XlsxWriter.
import pandas as pd

...

writer = pd.ExcelWriter('farm_data.xlsx', engine='xlsxwriter')
df.to_excel(writer, sheet_name='Sheet1')

workbook = writer.book
worksheet = writer.sheets['Sheet1']

chart = workbook.add_chart({'type': 'column'})

...
The charts in this document are heavily influenced by the output of Vincent a data visualisation tool that is also integrated with Pandas.
Contents:
- Introduction
- Pandas and XlsxWriter
- Chart Examples
- Code Examples
- Example: Column Chart
- Example: Column Chart with Axis Labels
- Example: Column Chart with rotated numbers
- Example: Line Chart
- Example: Chart with Legend
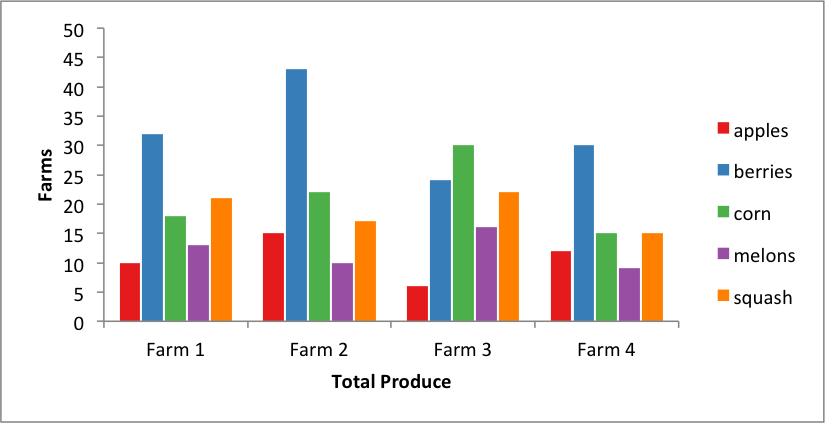
- Example: Chart with Legend on Top
- Example: Scatter Chart
- Example: Scatter Chart with user defined colours
- Example: Area Chart
- Example: Stacked Area Chart
- Example: Stacked Area Chart with more categories
- Example: Stacked Area Chart with stock data
- Example: Stacked Column Chart
- Example: Stacked Column Chart (Farm Data)
- Example: Grouped Column Chart
- Example: Grouped Column Chart (Farm Data)
- Example: Pie Chart
- Learn More