Introduction
Version 0.13 of Pandas added support for new Excel writer engines in addition to the two engines supported in previous versions: Xlwt and Openpyxl. The first of the new writer engines to be added is XlsxWriter.
XlsxWriter is a fully featured Excel writer that supports options such as autofilters, conditional formatting and charts.
XlsxWriter
XlsxWriter is a Python module for writing files in the Excel 2007+ XLSX file format, for example:
import xlsxwriter

# Create an new Excel file and add a worksheet.
workbook = xlsxwriter.Workbook('demo.xlsx')
worksheet = workbook.add_worksheet()

# Widen the first column to make the text clearer.
worksheet.set_column('A:A', 20)

# Add a bold format to use to highlight cells.
bold = workbook.add_format({'bold': 1})

# Write some simple text.
worksheet.write('A1', 'Hello')

# Text with formatting.
worksheet.write('A2', 'World', bold)

# Write some numbers, with row/column notation.
worksheet.write(2, 0, 123)
worksheet.write(3, 0, 123.456)

# Insert an image.
worksheet.insert_image('B5', 'logo.png')

workbook.close()
Creates a file like the following:
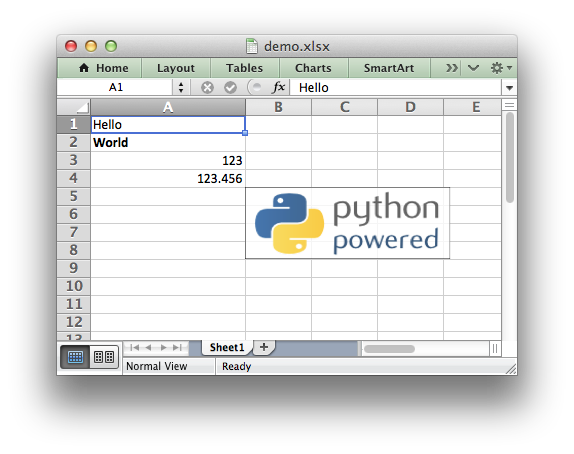
XlsxWriter can be used to write text, numbers, formulas and hyperlinks to multiple worksheets and it supports features such as formatting and many more, including:
- 100% compatible Excel XLSX files.
- Full formatting.
- Merged cells.
- Defined names.
- Charts.
- Autofilters.
- Data validation and drop down lists.
- Conditional formatting.
- Worksheet PNG/JPEG images.
- Rich multi-format strings.
- Cell comments.
- Memory optimisation mode for writing large files.
The XlsxWriter documentation contains more detailed information on the APIs used in this document. In particular the Chart Class and Working with Charts sections.
Pandas
Pandas is an open source, BSD-licensed library providing high-performance, easy-to-use data structures and data analysis tools for the Python programming language.
Vincent
Vincent is a data visualisation tool which is tightly integrated with Pandas. It builds visualizations using D3 and Vega:
From the Vincent documentation:
The data capabilities of Python. The visualization capabilities of JavaScript.
Vincent allows you to build Vega specifications in a Pythonic way, and performs type-checking to help ensure that your specifications are correct. It also has a number of convenience chart-building methods that quickly turn Python data structures into Vega visualization grammar, enabling graphical exploration. It allows for quick iteration of visualization designs via getters and setters on grammar elements, and outputs the final visualization to JSON.
Perhaps most importantly, Vincent has Pandas-Fu, and is built specifically to allow for quick plotting of DataFrames and Series.
Vincent builds really beautiful data visualisation in a simple straightforward way. The inspiration for this document comes from the Vincent documentation and the various examples shown in the quickstart guide.